Today, our Grade 6 students stepped into the exciting world of data handling, transforming everyday information into meaningful visual stories. The lesson began with a lively 4-pic-1-word activity that immediately hooked the students’ curiosity and helped them connect real-life situations with the concept of data.
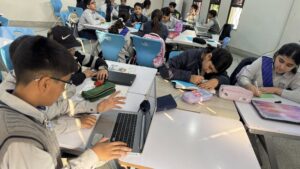
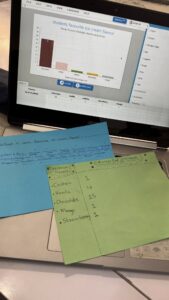
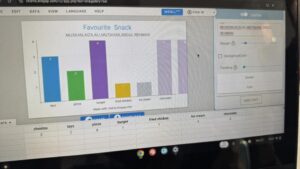
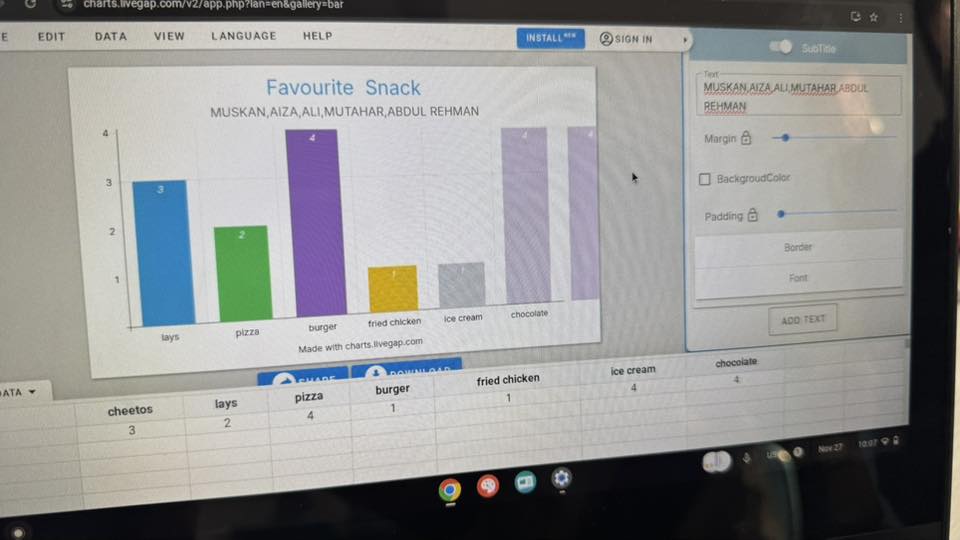
As the lesson progressed, students explored the complete journey of data—collecting it, organizing it, and finally representing it through bar graphs. Using Canva and online graph-generating tools, learners discovered how technology can elevate their understanding and creativity.
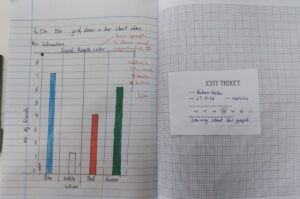
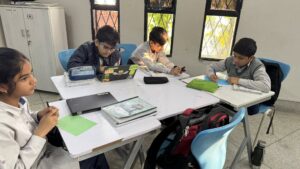
Working in mixed-ability groups, each child played an important role: some gathered data, others organized it into tables, and the high achievers crafted beautifully designed bar graphs along with analytical questions. This structure not only strengthened teamwork but also ensured that every learner contributed meaningfully at their own level.
Independent practice further deepened their understanding. Students interpreted graphs, created their own, and even supported peers through pair-check strategies—building confidence and developing critical thinking along the way.
The lesson wrapped up with a reflective class discussion where students shared challenges, insights, and creative choices. It was a proud moment to witness how confidently they talked about trends, comparisons, and the usefulness of graphs in daily life.
Through hands-on exploration, collaborative learning, and purposeful use of technology, our students didn’t just learn about bar graphs—they experienced how data helps us understand the world more clearly. Today, they didn’t just handle data; they made it come alive.